ABOUT

I am a remisier with a local Singapore stock broking house. This blog was set up as a personal endeavour for all stock investors to share their knowledge on stock investment, be it on Fundamental Analysis (FA) or Technical Analysis (TA). The combination of this knowledge would be FATA (发达), which means to prosper in Mandarin.
It is my sincere wish that members will benefit from this sharing of knowledge and prosper. For many of us, we need to make our money work harder for us so that we can have sufficient for retirement. But at the same time, be careful about your investment. As Warren Buffet said: "Do not lose your capital".
DISCLAIMER: It is important to state here that this information sharing and discussion is purely for that purpose - sharing and discussion. This blog was started in good faith by the administrator, but all investors should take personal responsibility for their stock investment decision. Neither the administrator of this blog nor any of the contributors to this sharing/forum will be responsible for any loss that you may suffer as a result of your investment. You are advised to do your own research before making any investment decision. It is also important to state that inevitably, there will be stocks where the administrator and/or blog members would have an open position (or interest) in. This is inevitable as surely we would "put our money where our mouth is". In no way does it mean that we are soliciting your support to "pump up" the stocks as it is totally your choice whether to trade that particular stock or not.

Wednesday, 29 October 2014

General commentary

If you have observed, during this current market correction, the high dividend yield stocks had held up reasonably well compared to most of the other stocks. For medium and long term investors,  this is much welcomed.
Investors ought to identify their own trading psychology and objective, whether it is long or short term, and trade accordingly. Many people, I know, are confused and do not have a clear picture of their stock trading objectives. As a result, they are neither here nor there. They trade rather randomly. This has often resulted in unfavourable results for them. 
Trading methodology is a combination of FA (Fundamental Analysis) and TA (Technical Analysis). So, the equilibrium of the equation would be FA + TA = Your trading methodology. If you are a day trader or short term trader, your reliance on TA would be higher, almost 100%. As you move towards a more medium and longer term view of your stock investment, then your reliance on FA would be much higher. That is why, Warren Buffet, who is basically a long term investor, can recently remarked in an interview that he doesn't care if DJIA had risen 500 pts or fallen 500 pts - he would still buy a company if he sees that it is a good company. Short term traders would need to be highly skilled in their TA, while long term traders would need to do their FA research well. There is no right or wrong style. Know your trading objective, brush up your skills for that type of investment objective and stick to the discipline of it.

Sunday, 12 October 2014

Popular US stocks: Google as at close of 10 Oct 2014

Google as at close of 10 Oct 2014
With Friday's big sell-down, Google is now effectively below its 150 day MA, having gone below its 20 day and 50 day MAs on the 26 Sep. Its MACD also went into negative territory on the 1 Oct.  Transaction was almost tripled the daily average. It went beyond its lower Bollinger Band. Its closing traded price was US$544.49. Its next immediate support is US$540. Looks like it may go down the slippery slope.

Popular US stocks: Facebook as at close of 10 Oct 2014

Facebook as at close of 10 Oct 2014
The price of FB does look like failing. It has broke below both the 20 day and 50 day MAs after Friday's trading session. Its next immediate support is at US$72. Its price at Friday's close was US$72.91. The MACD is also pointing downwards and in danger of falling into negative territory. Transaction volume was also higher than its daily average, with selling pressure outweighing buying pressure.

Popular US stocks: Apple Inc as at close of 10 Oct 2014

Apple as at 10 Oct 2014
Despite being below the 20 day MA for the previous 9 trading days, Apple is well supported by its US$99 support. The negative general market sentiment seems to have little impact on it. It is now above both its 20 day and 50 MAs, and well above its 150 day MA. However, its MACD does look weak and in danger of going into negative territory. Last done price was at US$100.73.

DJIA as at close of 10 Oct 2014

DJIA as at close of 10 Oct 2014
DJIA closed the week on Fri falling by 115.15 pts to 16,544.10 pts. With this fall, it is now clearly below its 150 day MA support. The next immediate horizontal support is at 16370 pts. MACD curve is also definitely in negative territory now, reflecting confirmed negative market sentiment. The probability of the DJIA falling further this coming week is higher now, given the negative indicators. If DJIA is to go for a 10% downward correction, then it will hit the 15400 pts horizontal support.

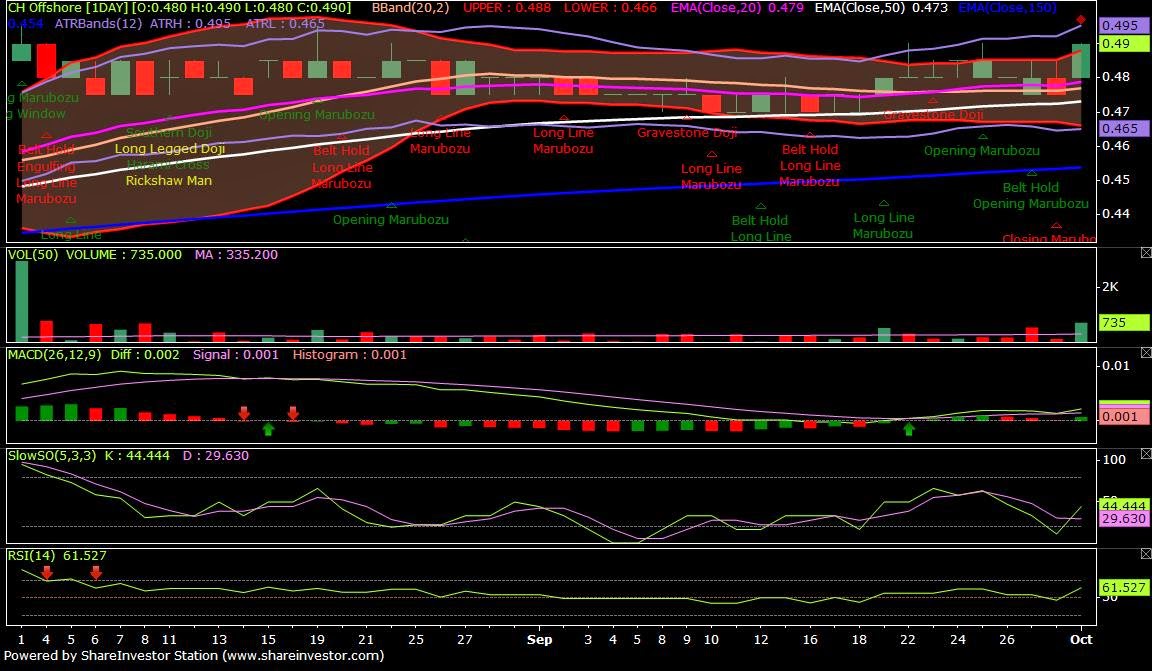
Stocks on technical watchlist: CH Offshore as at 10 Oct 2014

CH Offshore as at 10 Oct 2014
CH Offshore also showed resilience in the face of negative general market sentiment. It is still maintaining its price above its 20 day and 50 day. MACD is also in positive territory. Let's continue to monitor.

Stocks on technical watchlist: NeraTel as at 10 Oct 2014

NeraTel as at close of 10 Oct 2014
NeraTel also showed resilience, staying above its 20 day MA, although still having difficulty breaking above its horizontal resistance of $0.805. The current historical dividend yield of this stock is 7.4%.

Stocks on technical watchlist: SingPost as at 10 Oct 2014

SingPost as at close of 10 Oct 2014
Despite the general negative market sentiment, SingPost  is still holding up very well. Its price is still well above its 20 day and 50 day MAs. The Bollinger band squeeze breakout plus the "bullish pennant flag"  breakout seems quite resilient. Although there were some profit taking in the last few days, the volume is small. There are still alot of investors holding on to the stock, heading towards to the target of S$2.00

High dividend yield stock: Religare HTrust as at close of 10 Oct 2014

Religare HTrust as at close of 10 Oct 2014
Due to the general negative market sentiment, investors took profit on Religare, bringing it below its 20 day MA. The transaction volume was more than 3 times its daily average. However, towards the end of the day, buyers came in again to buy back the stock. Religare is likely to show more resilience in a bad market since it is in the healthcare industry. Its historical dividend yield is now 8.6%

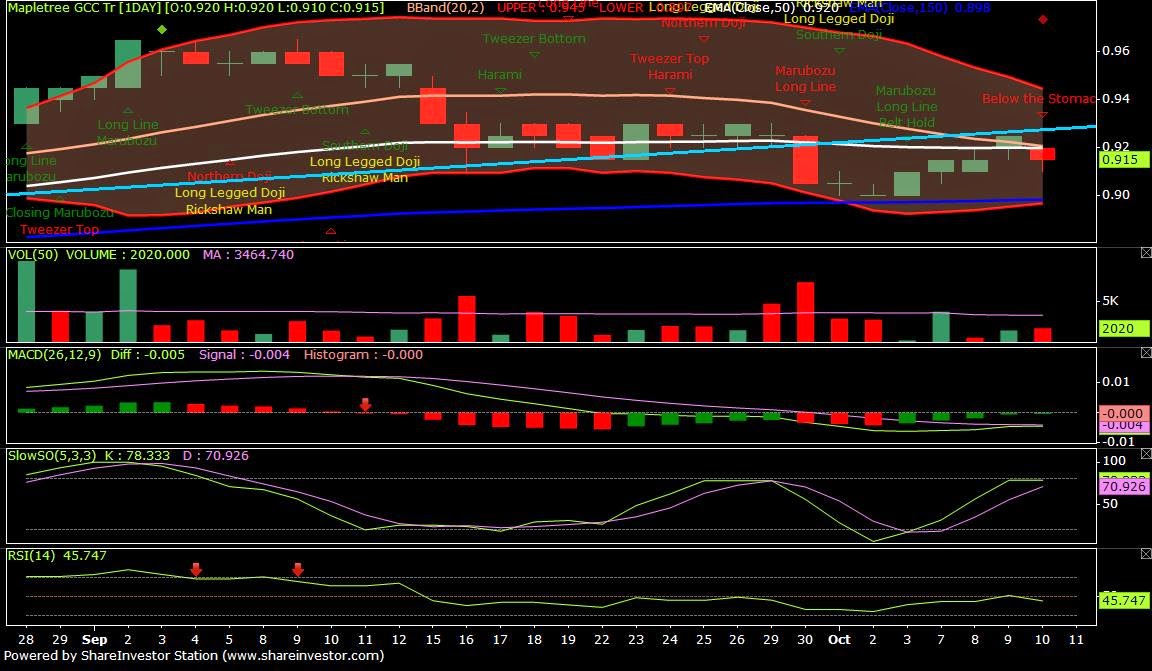
High dividend yield stock: Mapletree GCC as at close of 10 Oct 2014

Mapletree GCC as at close of 10 Oct 2014
Mapletree GCC moved below its 20 day MA again, negating the effort made on the previous day. However, it is still well above its 150 day MA. But in tandem with the general negative market sentiment, its MACD had gone into negative territory since Sep 23; but in general it is still holding up well. This is a Singapore real estate investment trust established with the investment strategy of principally investing, directly or indirectly, in a diversified portfolio of income-producing real estate in the Greater China region which is used primarily for commercial purposes (including real estate used predominantly for retail and/or office purposes), as well as real estate-related assets. Its historical dividend yield is now 6.7%.

Asian Pay Tv Tr as at close of 10 Oct 2014

Asian Pay Tv Tr as at close of 10 Oct 2014
Given the general negative market sentiment, Asian Pay Tv Tr maintained its sideway trading, unable to break above its immediate horizontal resistance of $0.84. The MACD curve has also consistently stayed in negative territory since Sep 22. However, the stochastic is showing some positive divergence by moving upwards despite the price moving sideways. Fri's transaction volume was also slightly higher than the daily average. The price also continues to stay above its 150 day MA support. So, despite the general negative market sentiment, Asian Pay Tv Tr is still showing resilience. With an estimated annual dividend yield now of about 10%, it will be attractive to pick up this stock again. The company has announced that from 3rd quarter 2014 onwards (i.e. for the period ending 30 September 2014), it will distribute its dividend quarterly. The company has also indicated that for the 2nd half of the year, it will continue to pay about 4.12 cents, which means a quarterly dividend of over 2 cents.

STI as at close of 10 Oct 2014

STI as at close of 10 Oct 2014
STI closed the week falling 35.38 pts to 3223.87 pts. It is now the 7th trading day that the STI is below its 150 day MA. MACD continues to be in negative territory. The immediate minor horizontal support is at 3220 pts. If the STI is to correct 10%, then it would go down to 3000 pts, which is one of its major support line.

Sunday, 5 October 2014

CH Offshore (as at 3 Oct 2014)

CH Offshore as at close of 3 Oct 2014

CH Offshore ended Fri with a "long-legged doji", indicating the market's indecisiveness. However, interest in the stock has been high for the last three days as seen by the more than doubled transaction volume. With its AGM coming on the 17 Oct, there could be something "cooking" beneath the surface there. Let's continue to monitor.

RELIGARE HOSPITALITY TRUST (as at 3 Oct 2014)

Religare as at close of 3 Oct 2014
Religare finally broke out of its ascending triangle formation, above its 0.95 resistance line today, accompanied by double its average daily transaction volume. For traders, this could be a buy signal. It is likely that Religare will continue with its upward movement the next few days. Its historical dividend yield is now 8.6%.

NERATEL (as at 3 Oct 2014)

NeraTel as at close of 3 Oct 2014

NeraTel attempted to break out of its horizontal resistance of 0.805 on Fri, but failed. It is still continuing to trade between its 20 day MA support and 0.805 resistance. Despite being up on Fri, its transaction volume was not impressive. It will need more effort to break above its resistance. The current historical dividend yield of this stock is 7.4%.

SingPost as at close of 3 Oct 2014

SingPost as at close of 3 Oct 2014
After the "bullish pennant flag"  breakout two days ago, there is some profit takers on Fri. However, volume is small, as can be seen by the low transaction volume. There are still alot of investors holding on to the stock, and therefore the stock is very likely to continue its ascent when trading resume on Tues (7 Oct) next week. Target is S$2.00.

MAPLETREE GCC TRUST (as at 3 Oct 2014)

Mapletree GCC as at close of 3 Oct 2014
Mapletree GCC continues to be supported by its 150 day MA today. The MACD histogram started showing 3R1G today, and the stochastic appears to be changing into an upward direction. If market sentiment improves, this stock may try to test its 50 day and 20 day MA resistance. This is a Singapore real estate investment trust established with the investment strategy of principally investing, directly or indirectly, in a diversified portfolio of income-producing real estate in the Greater China region which is used primarily for commercial purposes (including real estate used predominantly for retail and/or office purposes), as well as real estate-related assets. Its historical dividend yield is now 6.7%.

ASIAN PAY TV TRUST (as at 3 Oct 2014)

Asian Pay Tv Tr as at close of 3 Oct 2014
At the close of trading on Fri, Asian Pay Tv Tr formed a "doji" candlestick, showing the market's indecisiveness on this stock. However, it is still being supported by its 150 day MA. There appeared to be a slight divergence of the stochastic indicator from its price movement direction. While the price movement has been flat, the stochastic has now pointed in an upward direction. Also, the MACD histogram has been showing green for the past 3 trading days. There is therefore a high probability that the stock will move back up to try and break up above its 50 day and 20 day MAs again. With an estimated annual dividend yield now of about 10%, it will be attractive to pick up this stock again. The company has announced that from 3rd quarter 2014 onwards (i.e. for the period ending 30 September 2014), it will distribute its dividend quarterly. The company has also indicated that for the 2nd half of the year, it will continue to pay about 4.12 cents, which means a quarterly dividend of over 2 cents.
STI as at close of 3 Oct 2014
Despite having risen 24.53 pts to 3253.24 pts on Fri, STI is still below its 150 day MA since Wed. With Fri's rise, it has now formed a "bullish engulfing" candlestick pattern. Such a pattern has a moderate probability of predicting the next move; i.e. STI has the moderate probability of moving up the next trading day. Overall market sentiment is still weak as the MACD has gone below its horizontal zero line; but with the MACD histogram showing 3R1G, there is still hope that STI will go above its 150 day MA quite soon.

Saturday, 4 October 2014

DJIA as at close of 3 Oct 2014

DJIA as at close of 3 Oct 2014
DJIA was up 208.64 pts on Fri, following better non-farm payroll figures. With that it recovered most of the 239 pts fall that had occurred on Wed and Thur. The DJIA is now at 17,009.69 pts, well above its 16733 pts horizontal support. However, the technical indicators are still weak. The index is still below its 20 day moving average which is now its resistance. There will be more confidence if the DJIA goes back above the 20 day MA. With the MACD histogram showing 4R1G, there is still hope that the index may turn back up again to break new records.

Friday, 3 October 2014

DJIA as at closing of 2 Oct 2014

DJIA as at closing of 2 Oct 2014
DOW JONES INDUSTRIAL AVERAGE INDEX (as at 2 Oct 2014)
After Wednesday's fall of 235 pts, DJIA fell only 3.66 pts yesterday, forming a "spinning top" candlestick. This "spinning top" candlestick is a sign of indecision. However, looking at the over technical indicators, the market sentiment is still weak. The index is still supported by the horizontal support of 16733 pts and the converging 150 days MA. If it continues to fall below this support and the 150 day MA, its next horizontal support is at 16580 pts, failing which, the next support is at 16370 pts. This 16370 pts was where it bounced back up on the 8 Aug after it had went below the 150 day MA. If it continues to go below this, then it could be a start of a potential bear trend.

Thursday, 2 October 2014

Google as at 1 Oct 2014

Google as at 1 Oct 2014
GOOGLE INC (as at 1 Oct 2014)
Out of the 3 popular stocks (Apple, Facebook and Google), Google appears the weakest. It has gone below both the 20 day and 50 day MAs now, and is testing the 150 day MA. Its immediate support of US$566 also coincide with its 150 day MA now. If market sentiment continues to be weak, it is likely to go below 150 day MA to test the next horizontal support at US$541. Last done price was US$568.27.
Facebook as at 1 Oct 2014
FACEBOOK INC (as at 1 Oct 2014)
FB went slightly below its 20 day MA on the 1 Oct. Just like Apple, its 20 day and 50 day MAs are converging, and as such, it is likely to go below its 50 day MA should general market sentiment continue to be negative. However, it would appear that FB would be more resilient than Apple, and less likely to test the 150 day MA support. Its immediate support is at US$76, failing which it will be US$72 and US$68 in that order. Last done price was at US$76.55.
Apple as at 1 Oct 2014
APPLE INC (as at 1 Oct 2014)
Apple went below its 20 day MA support the last few days, and as the 20 day and 50 day MAs are converging, it is likely that it will go below its 50 day MA as well. Its immediate horizontal support is US$99, failing which it will be US$96.60 and US$93.50 in that order. If general market sentiment continues to be weak, then the 20 day and 50 day MAs are likely to merge with the 150 day MA, just like in April this year. If that happens, then it is likely to bring the price down to about US$90 - US$92. Last done price was at US$99.18.
SingPost as at 2 Oct 2014
After breaking out, upwards, of its "bullish pennant flag" yesterday, Singpost continues to climb today, trading between 1.84 and 1.885, despite the negative sentiment of the general market. The indicators are all still very positive, and it looks like it is aiming for the S$2.00 mark. However, at this moment of writing, there seems to be a slight tilt towards profit taking as there are 50.9% of willing sellers vs 49.1% of willing buyers.
DJIA as at closing of 1 Oct 2014
DJIA fell more than 235 last night. It is now below both the 20 day and 50 day MAs. This is a downward breakout from the "Bollinger band squeeze" and could be potentially powerful. Its immediate horizontal support is at 16733 pts, which is now converging with the 150 day MA. If it continues to fall below this support and the 150 day MA, its next horizontal support is at 16580 pts, failing which, the next support is at 16370 pts. This 16370 pts was where it bounce back up on the 8 Aug after it had went below the 150 day MA. If it continues to go below this, then it could be a start of a potential bear trend.

STI Update

STI is now at about 3244 pts.
Immediate support is at 3240 pts, failing which there are many minor horizontal supports at: 3220, 3185 and 3060 pts. The major horizontal support would be at 3000 pts. Within the last 52 weeks, there were two rebounds from this 3000 pts support line when the STI went below its 150 day MA.
STI as at 9.45 am on 2 Oct 2014
STI effectively fell below the 150 day MA this morning. If it continues to be below the 150 day MA for the next few days, it would signal a potential bear trend. So, investors who are on "long" positions, please trade with caution. In fact, the first signal of weakness came about when on 15 Sep it fell below the 20 day MA, and subsequently on 16 Sep it fell both below its uptrend support line (see yellow line in chart) and also the 50 day MA (white curve). Then on 26 Sep, it fell below its horizontal support line at 3290 pts, and on 30 Sep fell below the next horizontal support line of 3275 pts. Yesterday and today, it is below the 150 day MA. MACD was already below its zero horizontal line on the 17 Sep, indicating negative market sentiment since then.

Wednesday, 1 October 2014

SingPost 2nd breakout

SingPost chart as at 3.46 pm today
SingPost broke out upwards of its "bullish pennant flag" today, and is now up 5.5 cents (3.06%) to $1.85. This is the second breakout in a week. The transaction volume was more than doubled the 50 day average. MACD and all the other indicators showed very positive signals. It is possible that it may hit $2.00.
CH Offshore as at 1 Oct 2014, 10.50 am
After what I had said yesterday, CH Offshore seem to be attempting a breakout this morning (look at chart) with high transaction volume. This is a good sign. A breakout above $0.50 would be convincing, and the next resistance would be at 0.525. Follow closely.
STI as at close of 30Sep2014
CIC (China Investment Corporation), the sovereign-wealth fund of China, reduced its share of Noble from 13.8% to 9.4% today, causing a big sell down. Noble's price dropped 6.81% at closing. CIC was said to have sold about 300 million share at S$1.32 a piece, down from Monday's close of S$1.395. Being a component stock of STI, it contributed to the fall of STI to 3276.74 pts from yesterday's close of 3289.72 pts. The fall in STI today is putting more downward pressure on the index. MACD and RSI indicators continue to be weak. The STI has broken below its 3275 pts horizontal support. Its next support is the 150 day MA, failing which would signal a bearish trend.